

One of the most frustrating things about financial analysis today is stitching together disparate data sets in order to justify decisions or determine the root cause of forecast variance against consolidated actuals. The data needs are completely legitimate; the problem is that the tools available to the business community to accomplish such tasks generally fall into one of two categories:
- Enterprise/corporate performance management (EPM/CPM)—systems designed to aggregate financial data for close, forecasting/budgeting, and financial planning and analysis (FP&A) reporting processes.
- General ledger (GL) reporting—systems designed to pull transaction-level detail in a generally static fashion.
While there’s nothing inherently wrong with either of these approaches, neither provides an end-to-end perspective for the finance community.
And that’s exactly what today’s finance leaders need, and now can have.
What Exactly Is a “Million-Dollar” Click?
Take the close system, for example. Your transaction GL data flows into your consolidation tool, and the business rules defined within that engine eliminate, balance, and aggregate the data for high-level reporting. For reporting purposes, that data often is then moved into another financial reporting engine where it’s placed side-by-side with forecasts, so the variances easily can be seen.

The legacy path for financial data analysis.
But how do you go back, to investigate, to ensure the transactions support the aggregated patterns you see?
Some platforms offer a limited ability to drill back to details based on the small subset of GL data fed into the EPM environment. The answers, unfortunately, often are not there. The root cause you seek lives in the subledger details, in the attached documents, in the line notes, or in other operational environments. Using such platforms, it can take days or even weeks to access the root cause of one detailed financial question.
And when you try to add into the analysis mix the other non-financial systems—such as sales forecasting or customer relationship management (CRM) environments—the inability to see a unified view of the enterprise is exacerbated.
As an example, take a look at the following report:
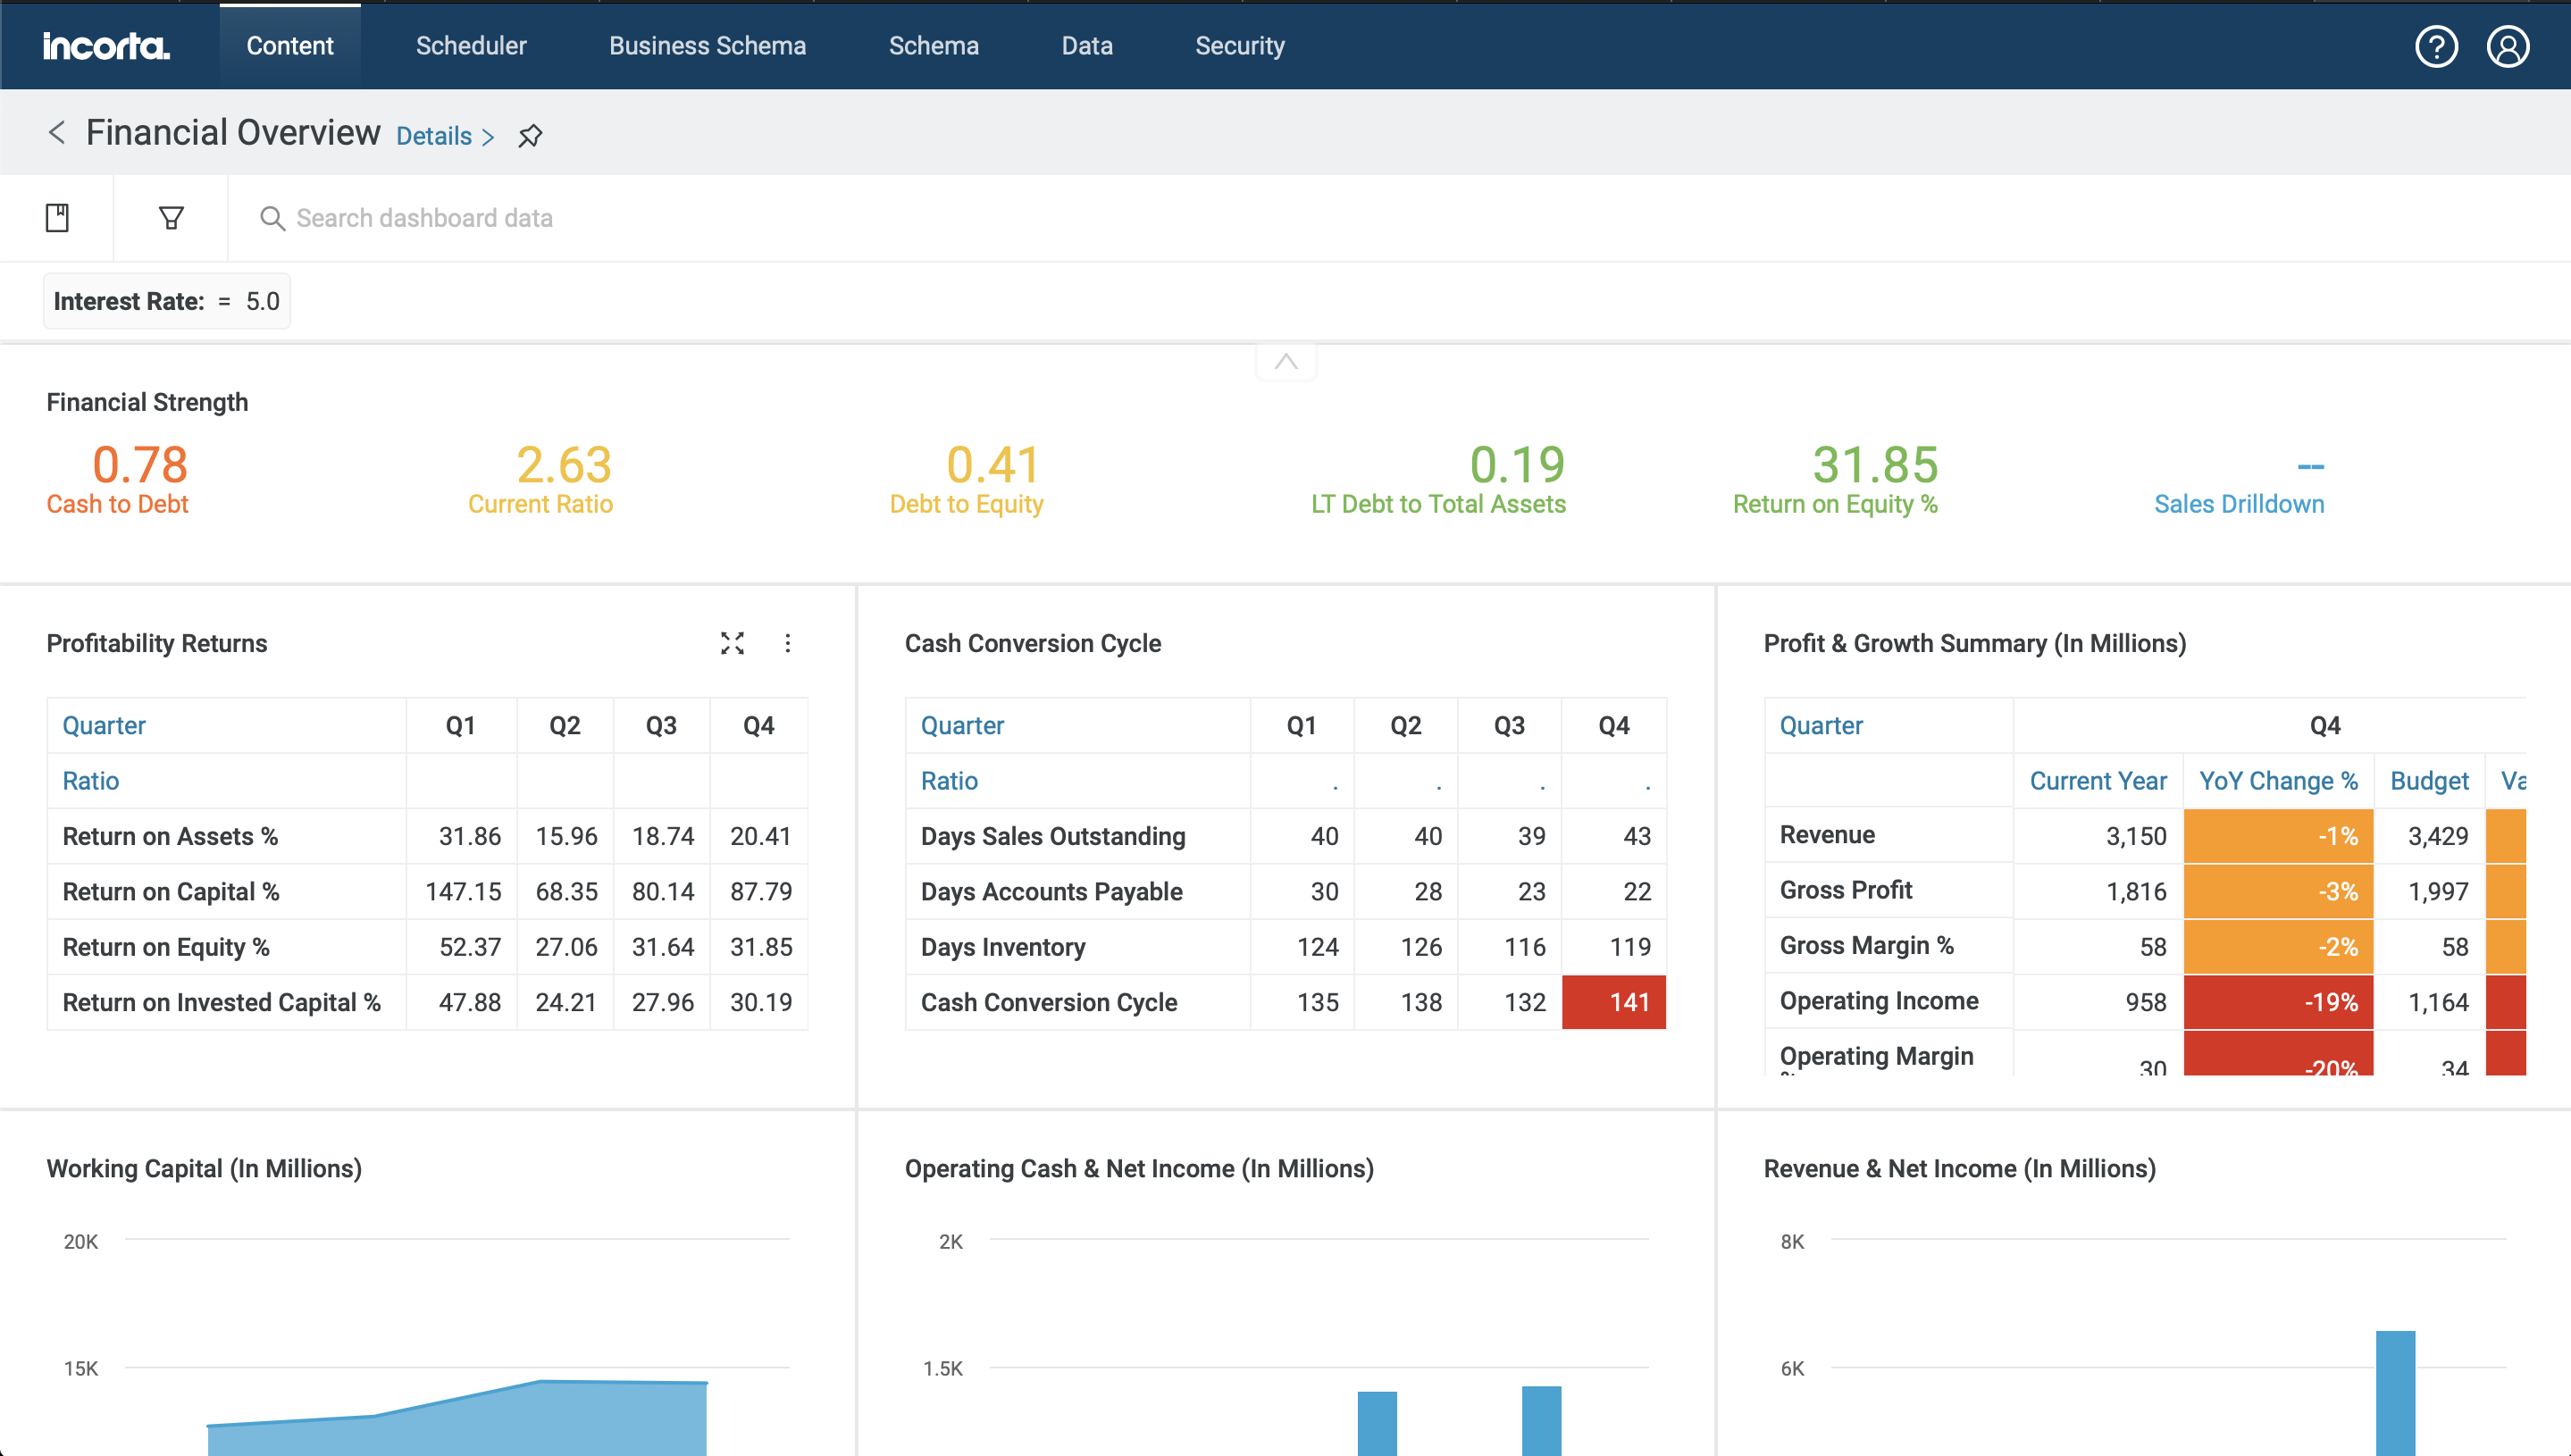
An initial report shows the Cash Conversion Cycle increasing in length.
Often, when we see a pattern or outlier in aggregated data, our natural inclination is to try to find the reason behind that pattern: if our cash conversion cycle is trending poorly in Q4, we should simply be able to click on that number to get more details.
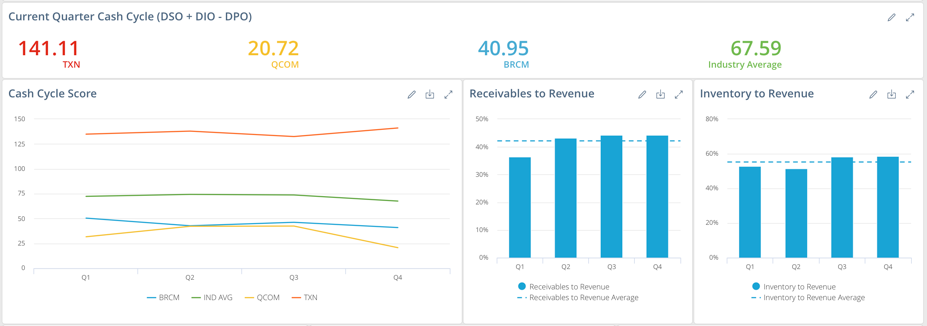
A drilldown containing further detail around cash cycle score and comparisons to revenue.
And that’s only one step down the analysis chain. Finding a pattern in receivables may drive you to explain another outlier in payables as part of the overall root cause. In a perfect world, this additional step would be a single, additional click.
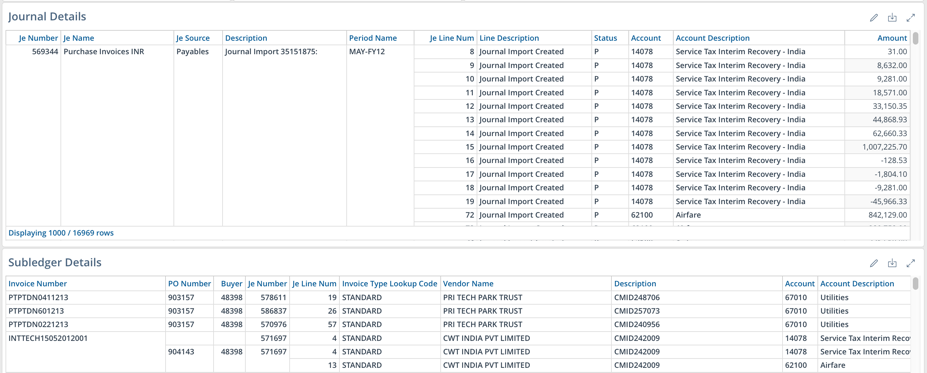
Drilling into the ledger and subledger to see spending based on patterns previously observed.
You probably see where I’m going here. Ultimately, a complete platform for financial analysis allows easy movement from high-level patterns in either actuals, budget, or forecast down into all supporting transactional data.
But the reality is, in most environments today, the simple, three-click analysis we just described isn’t simple at all. It requires the user to interact with three, four, or five or more systems:
- They log into a reporting environment to see how the budget and consolidated actuals compare.
- Then, to get budget and close details, they log into two separate EPM components.
- Finally, to see the supporting transactions, they likely run ledger- and sub ledger-based reports directly using a GL reporting tool because the original business intelligence (BI) environment does not hold the current information.
You certainly can attempt to construct a unified reporting layer combining all of this data with legacy technology. By the time, however, you create the data warehouse, build cubes, and tie both together using extremely convoluted links in a legacy dashboarding environment—like Oracle Business Intelligence, Cognos, or Business Objects (just to name a few)—that simple click you wanted to get to the transaction-level details costs enormous amounts of money to engineer.
Very often, it’s a “million-dollar click.”
Seems preposterous, but many financial leaders simply accept the concept of the million-dollar click because they view it as the cost of accessing this business-critical information. For years, they’ve been told they need to involve multiple experts—database analysts, BI modelers, reports builders, etc.—at high hourly rates and lengthy project timelines to:
- pull transactions details into a structure—like a data mart—where business users will be able to perform detailed drilldowns;
- map the data sources into a semantic layer and provide links between the products;
- create utility reports to generate filtered data sets based on variables (driving documents), and then create links on a column-by-column basis between the aggregate source reports to the detailed transactional reports.
This all adds up to 3–4 people spending six or more months just to stand up a series of basic, predefined reports and links. Any additional link points users envision afterwards require new work and/or changes to underlying data or systems. These lengthy, legacy processes create a never-ending, expensive cycle of custom build and maintain.
But it doesn’t have to be that way anymore. This process should be a native part of your reporting analytic platform—not something you have to build custom. And now it can be.
Eliminating the Million-dollar Click in Enterprise Analytics
Today, there’s an engine uniquely built to deliver the nimble, timely, and governed analysis the business community demands. It’s from my company Incorta.
With Incorta, top-line-to-transaction analysis that combines qualitative and quantitative data in a single engine is not just possible—it’s there and available all of the time, without the million-dollar-per-question price tag. That’s because we designed our engine to do just that.
One primary way we accomplished this feat is by building the links between data values—the drill paths—into the Incorta engine. With this approach, you don’t have to preconceive where the user is going to click or build special structures to ensure performance. Business users can ask any question they want, at any time, and easily get answers.
Take premier point-of-sale provider and Incorta customer Toast, for example. Toast helps thousands of restaurants increase sales and develop smart front-of-house and back-of-house processes. Internally, Toast relies on Incorta’s data analysis capabilities to streamline internal processes and drive increased revenue. From sales pipeline to GL transactions—and every step in between—Incorta is the bridge that delivers structures and ad-hoc analysis to Toast’s business community.
Here’s how. Instead of moving data from system to system and trying to stitch it together, Incorta delivers the information Toast users need (from transaction to aggregate) for effective decision making. With Incorta, Toast’s business community no longer spends time collecting data—they spend time using it.
“Incorta lets us more quickly fine-tune our business strategy, which ultimately increases revenue. Before, it could take weeks to sort out all the noise when we needed to get a handle on our previous month’s performance. Now, we know in real time what’s going well and what isn’t. It’s incredible to have that kind of information at our fingertips.”
—Tim Barash, CFO at Toast
Our success at Toast is a great demonstration of what makes Incorta unique: Incorta is an analytic database focused on the needs of the business.
Now, I know a lot of vendors say their tools focus on the needs of the business community. The difference, however, is in the details.
Incorta customer Broadcom is a great example of unfettered access to and analysis of business data by business users. Broadcom uses Incorta as the analytic platform against which they analyze billions of rows of aggregate and transaction-level financial data. With Incorta, Broadcom business users no longer are constrained—they see patterns and perform on their own the analysis needed to answer any unanticipated question that comes up.
“It used to take 8–12 weeks to get a report from request to production. With Incorta, business users can do that on their own instantaneously.”
—Ajit Oak, Lead Business Intelligence Architect at Broadcom
Incorta can deliver these amazing results because it’s not a tool—it’s a platform. And it’s purposefully designed to meet the needs of the business community. As such, it can provide:
- self-service analysis (business users can create and modify reports on their own);
- ad-hoc capabilities (users can easily take a previously unconsidered analysis path when they see something they want to dig into);
- pre-built content (users don’t have to build everything from scratch);
- business-driven logic (logic that’s defined by actual business users);
- analytics without harm (users can query data without harm, return seemingly “bad” queries in a reasonable amount of time, and move forward without IT intervention when bad queries are encountered); and
- performance measured in seconds or sub-seconds.
While other solutions may do one or some of the above—only Incorta does all of them. It’s this combination of capabilities within a single platform that makes Incorta the only vendor able to eliminate that million-dollar click. And it’s why we believe Incorta is the singular best business analytic platform on the market today.
Want to learn more about how Incorta eliminates the million-dollar click? Contact me directly at mike.nader@incorta.com.