
Here's how it works and why the architecture behind it matters.
Think about what a typical decision cycle actually involves. A finance analyst spots a variance that needs a planning adjustment. To act on it, they export the relevant data, rebuild the model, circulate it for approval over email, and then manually update the ERP — a process that takes days and involves three or four people, each working from data that gets a little older at every handoff. The decision that gets entered into the system at the end of that chain is based on a version of the data that no longer exists.
The reporting side of the problem is similar. When a planning team needs to distribute a monthly operations report to seven stakeholders — each requiring a version scoped to their region or business unit — someone has to build those seven versions by hand. Half a day of work, minimum. And once the reports are sent, they're static: if the underlying data changes, there's no way to push an update, so stakeholders end up making decisions from whatever snapshot they happened to receive.
Neither of these is an unusual situation. They're how most organizations manage operational decisions at scale — and both share the same structural gap: the insight lives in the analytics platform, while the action and the visibility live somewhere else.
Orchestrate Workflows handles the operational side of the insight-to-action problem: getting decisions out of Incorta and back into the systems and stakeholders that need them. There are three core capabilities.
When a decision is made inside Incorta - a planning adjustment, an approved exception, an updated allocation - Orchestrate Workflows can push that change back to the system of record directly, without requiring a manual export-import cycle or a separate integration project.
Here's what that looks like in practice. A financial planning team is reviewing December performance. Last year closed around 1,300 units. The current forecast projects 1,390. But the team knows December is peak season - demand is strong, promotional spend is already planned - and they want to push the target to 1,499 units, with revenue projected at $23,227 and marketing spend adjusted to $2,974 to support it. They update the figures, add a note to finance explaining the rationale-— this is holiday peak, the plan is aggressive, it's backed by promo spend - and save.
That's it. The numbers write back directly to the source planning system. Finance sees the updated plan. The demand gen team sees the same spend figures and the same reasoning. No export, no email thread, no reconciliation meeting a week later when someone realizes two teams are working from different versions of the forecast.
The market sometimes calls this reverse ETL. The framing is accurate but undersells the governance dimension: it's not just moving data back upstream, it's doing it within the same access controls and audit infrastructure that governed the original analysis.
Report bursting is the capability to distribute a report to many stakeholders simultaneously, with each version automatically filtered and formatted for its intended recipient. Instead of producing one version of a report that contains everything and is relevant to no one in particular — or producing twelve versions manually — the platform generates and routes them automatically based on role, region, business unit, or whatever dimension the report is organized around.
The time savings are the obvious benefit. The less obvious benefit is accuracy: when the same underlying data populates every version of a report, you eliminate the reconciliation errors that arise when different teams are working from manually produced exports at different points in time.
Decisions rarely affect only one system. An inventory adjustment touches the ERP and the procurement platform. A revenue update touches the CRM and the financial reporting system. Orchestrate Workflows connects Incorta to the rest of the stack — SAP, Oracle, Salesforce, and others — allowing a single decision or trigger inside the platform to initiate coordinated updates across multiple downstream systems. New integrations can be added as needs evolve, without requiring full re-engineering of existing workflows.
Write-back sounds straightforward. In practice, it's one of the most trust-sensitive operations in enterprise data management. Writing incorrect or stale data back to a system of record doesn't just produce a bad report — it can corrupt the authoritative data that the rest of the organization depends on.
The reason Orchestrate Workflows can do this reliably is the same reason Incorta's analytics are reliable: the data being written back was never a copy. Incorta's Direct Data Mapping technology keeps the platform connected to source-level data, so there's no reconciliation gap between what Incorta sees and what the system of record holds. The write-back is grounded in an accurate, current understanding of the data state — not in an export from last night's ETL run.
That distinction matters most in finance and supply chain, where decisions are made on the basis of yesterday's numbers and acted on against today's reality. Orchestrate Workflows keeps both sides of that equation aligned.
Most data governance thinking is oriented inward: who can access what, what can be queried, what requires approval before it's viewed. Orchestrate Workflows extends that orientation outward: who can write what back to which systems, under what conditions, with what audit trail.
This matters because write-back without governance is a significant operational risk. An analytics platform that makes it easy to push changes to source systems with no record of who authorized what is a platform that's going to create compliance problems.
Orchestrate Workflows handles this through the same governance model that covers everything else in Incorta — same RBAC, same audit logging, same lineage tracking. Every write-back is associated with the user or process that initiated it, the data state that prompted it, and the approval chain that authorized it. The audit trail doesn't start when the data leaves the platform — it starts at the original analysis.
Finance and Close Processes
Month-end close is one of the highest-stakes, highest-friction workflows in any organization. Orchestrate Workflows supports the write-back dimension of close — pushing approved adjustments and reconciled figures back to source systems and distributing the resulting reports to the right stakeholders automatically. What used to take multiple days of manual coordination compresses significantly when the distribution and write-back steps are automated.
Supply Chain and Inventory Management
When an inventory signal requires a procurement response — a reorder, an expedite, a vendor notification — the decision needs to reach multiple systems and multiple stakeholders at once. Orchestrate Workflows handles that distribution, ensuring the ERP, the procurement platform, and the relevant team members all receive consistent, current information from the same source.
Planning and Forecasting Cycles
Planning cycles involve writing a lot of data back to source systems — updated forecasts, revised allocations, approved targets. The manual version of this process involves exporting data from one system, reformatting it, and importing it into another. Orchestrate Workflows replaces that with a governed, automated pathway that keeps planning data and operational data in sync — the same way the December forecast example above works in practice, but applied across every planning cycle the business runs.
Orchestrate Workflows is the outbound half of a complete insight-to-action capability. Incorta Builder provides the interface for human-initiated actions — apps where a user makes a decision and takes the next step. Agentic Workflows handles automated responses to data conditions. Orchestrate Workflows handles the downstream consequences of those decisions: the write-back to source systems, the distribution to stakeholders, the cross-platform coordination.
Together, they represent a complete loop: data comes in from source systems, gets analyzed and acted on inside the platform, and the results flow back out to the systems that need them.
Learn more at incorta.com/incorta-builder, or watch this demo.
The way enterprise software gets built is changing - and it's not a slow change. Teams that used to wait six months for IT to deliver an app are now describing what they need in plain language and seeing something functional the same week. That shift is real, and it's creating pressure on every analytics platform to answer a question it wasn't originally designed to answer: can your users act on data here, or do they have to go somewhere else to do it?
Incorta Builder is our answer to that question. Here's what it is, how it works, and why the data foundation it runs on makes a meaningful difference.
Most analytics platforms are very good at getting to the insight. They surface the answer, display the variance, flag the exception. What they don't do is close the loop. The moment a user needs to act on what they've found—submit an approval, update a record, trigger a downstream process, run a what-if scenario with live numbers—they leave the platform. They open a spreadsheet. They file an IT request. They wait.
That gap between finding the answer and completing the next step is where time disappears, data drifts, and the value of the original analysis erodes. By the time the action happens, the data behind it is already a version old.
Incorta Builder is designed to eliminate that gap by letting teams build the apps that complete the work—directly on top of the same live, governed data they're already analyzing.
Builder is a tightly integrated, low-code platform for creating custom AI-powered apps within the Incorta environment. Apps built in Builder aren't separate tools that happen to pull from Incorta data—they're first-class applications that run inside the platform's governance model, inherit its security controls, and stay connected to live source data without any additional pipelines or copies.
The technical foundation includes:
AI-assisted app creation and vibe-coding capabilities mean that the technical barrier to building has dropped significantly. A business analyst with domain knowledge and a clear picture of the workflow they need can get to a working prototype in days. The same process that used to require formal requirements documents, backlog prioritization, engineering resources, and a QA cycle now starts with describing what you're trying to accomplish.
There's a category of app-building tools that makes it easy to build interfaces. What's harder—and what most of them don't solve—is ensuring the data those interfaces run on is accurate, current, and governed.
Builder apps can query live data directly from Databricks, Snowflake, Oracle Apps, SAP, and Salesforce via REST API or JDBC connections, and can perform cross-platform joins for data analysis across those sources. Most analytics and app platforms connect to a warehouse or lakehouse that holds a copy of operational data. The copy is recent, but it's still a copy—it arrived through ETL, carries some lag, and may not preserve the row-level fidelity that operational decisions require.
Builder apps connect directly to source systems without replicating data through a transformation pipeline. The data an app displays and acts on is source-identical. There's no reconciliation gap between what the app sees and what the system of record holds.
For operational decisions, that matters. A finance app that runs a what-if scenario on numbers from yesterday is a different thing than one running on today's actuals via a live connection. An inventory app making a replenishment recommendation on data that's six hours old is making a different recommendation than one working from the current state.
One of the consistent failure modes for enterprise app democratization is governance. A platform makes it easy to build apps, usage grows, and eventually someone surfaces a compliance issue or a data leak—because the apps were built outside the governance model the organization relies on.
Builder sidesteps that failure mode structurally. Because apps live inside Incorta's platform, they inherit the same RBAC, row-level security, and audit infrastructure that governs everything else. There's no separate security model to configure, no permission mapping to maintain, no question of whether the app is respecting the same access rules as the dashboard next to it.
From an IT and data governance standpoint, this changes the conversation. Instead of managing a parallel universe of informal apps built on copied data with inconsistent permissions, you have a governed catalog of production-ready applications built on the same foundation as everything else.
Early adoption follows a practical pattern. In the initial release, IT teams, BI developers, and advanced analysts handle building and deploying apps. Business users consume them. That's the model that gets to production fastest with the least governance risk.
Over time, AI-assisted creation capabilities lower the barrier further—making it realistic for technically minded business users to build for their own teams without requiring engineering support. The goal is to make it possible for the people who understand the problem best to participate in building the solution, rather than relying entirely on a requirements handoff process that inevitably loses context.
The business case for Builder is most compelling when you look at what it replaces. Many organizations are running a mix of niche SaaS tools—lightweight CRM overlays, approval routing tools, inventory management interfaces, planning apps—each purchased to solve a specific workflow problem, each requiring its own login, its own data integration, its own training program, and its own license renewal.
Builder doesn't replace mature, full-featured platforms where the breadth of functionality justifies the complexity. It does replace the tail end of that SaaS stack—the tools that were bought because building something custom felt impossible, and that now add cost, sprawl, and integration overhead without delivering proportionate value.
The right use cases are the targeted ones: a workflow that a team runs weekly but that doesn't justify a standalone software purchase; an approval process that needs to know something about your ERP data to work correctly; a planning interface that needs to write back to a source system. Builder handles those cleanly, without adding another system to the data governance map.
Builder is one part of a larger architectural direction in Incorta Intelligence. The platform's premise -that insight and action should happen in the same environment, on the same data, under the same governance model - requires both the ability to analyze and the ability to act. Builder handles the action surface for human-initiated workflows. Agentic Workflows handles the automated ones. Orchestrate Workflows handles the write-back and downstream distribution.
Together, they represent a different answer to the question every analytics platform is now being asked: what happens after the insight? Incorta's answer is that it happens here—in the same platform, on the same data, without leaving to go somewhere else.

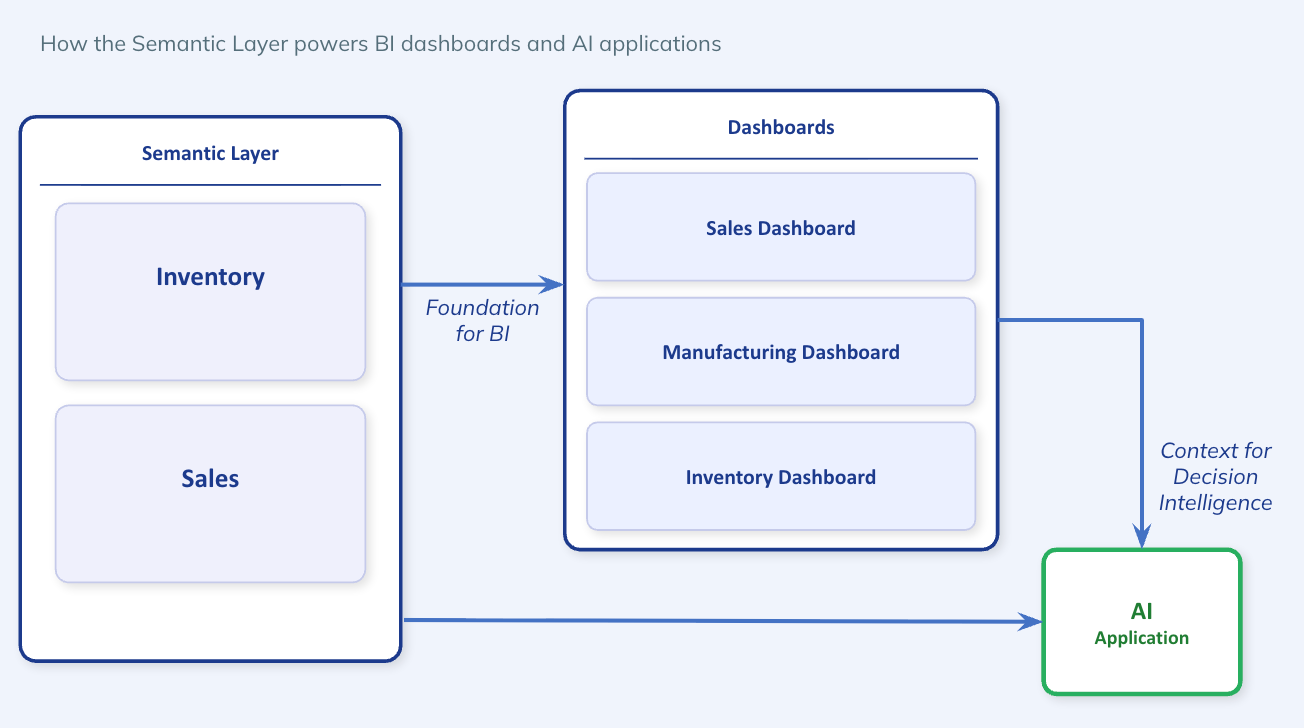
Many analytics vendors and thought leaders have been proclaiming that "dashboards are dead," suggesting that AI-driven chat and automated insights would render the traditional BI dashboards as obsolete. They aren't entirely wrong in terms of the sentiment. However, the reality is more transformative than the morbid tag line suggests. Dashboards aren't being replaced; they are being supercharged to serve as the foundation for the next generation of decision intelligence.
The shift we are seeing moves us away from dashboards as isolated, static tools for interactive analysis toward agentic applications and workflows. In this new era, the dashboard serves as the critical context for AI agents to understand business logic that sits in a layer above the semantic layer, navigate complex data lineage, and deliver explainable insights that can be extended to handle ad-hoc follow up questions, build advanced analytical applications and trigger actionable decision workflows.
Every mature organization began its analytics journey with a noble charter; purpose built and curated dashboards, a higher level abstraction to hold business logic for aggregated and cross fact, cross entity analysis which was the basis for charts and visual analysis. The drill down and drill across logic between these insights then served as the blueprint to get to actionable insights. However, these fell short on two counts, the need to switch to another system to take action and the repetitive process of interacting manually to find the proverbial “needle in the haystack”.
Despite these shortcomings, every organization has these golden dashboards that already have the business context codified by domain and functional experts. And, they are already the lifeblood of daily operations, where they are run every single day to make decisions. These dashboard insights serve as query patterns that supplement the semantic layer and all other context that is imputed into AI workspaces for agentic applications.
With the latest capabilities of large language models, the future of last mile analytics consumption will be transformed. It will see dashboards serve as a stepping stone to building vibe coded AI applications. The goal of this evolution isn't just to make prettier charts; it's to shorten the cycle from data to action. By embedding agentic insights and workflows into purpose built analytical applications, modern analytical platforms can now autonomously surface anomalies, identify key drivers, and even trigger business actions like sending a PDF report to stakeholders in their team messaging or collaboration platforms of choice. But, through it all, a handful of curated and governed dashboards serve as a key ingredient to an evolving context layer fueling the AI applications.
Dashboards are no longer the end of the analytical journey; they are the starting knowledge base for a more intelligent, conversational, and automated future.
Incorta has been recognized as a Niche Player for the fifth consecutive year in the 2026 Gartner® Magic Quadrant™ for Analytics and Business Intelligence Platforms. We think this recognition reflects our continued commitment to our platform's evolution to meet the demands of the next generation of enterprise data.
Each time, the Gartner Magic Quadrant offers more than a vendor evaluation according to us. To us, the capabilities Gartner chooses to evaluate are one of the clearest signals in the industry of where enterprise analytics is actually heading.
Their addition is not a coincidence in our opinion. It reflects that AI has moved from a feature to foundational infrastructure - and that enterprise buyers are now actively evaluating platforms on their ability to deliver it at scale.
The addition of AI-native capabilities to the Gartner® evaluation framework confirms, as per us, what we have been building toward. Enterprises don't want AI bolted onto a BI tool. They want it embedded in a platform that already understands their ERP data -the schemas, the security models, the business context. That is exactly where Incorta operates.
We feel this year's recognition highlights not only our execution and vision, but the platform's readiness to deliver on the AI capabilities now being formally evaluated across the industry.
To us, the addition of Agentic Insights to Gartner evaluation reflects a fundamental shift in what enterprise analytics is expected to do. Agentic analytics moves beyond answering questions to proactively surfacing what matters: identifying anomalies, flagging risks, and triggering actions without waiting for a human prompt.
For enterprises running on Oracle or SAP, this is especially critical. The volume of operational data flowing through ERP systems is too large for any analytics team to monitor manually. Agentic capabilities allow the platform to watch that data continuously - surfacing a supplier performance deviation, a cash flow anomaly, or a production yield drop before it becomes a problem.
This is the shift from analytics as a reporting layer to analytics as an active participant in operational decision-making.
Semantic modelling has long been a differentiator for platforms built around ERP data - and the decision by Gartner to formally evaluate it reflects the pressure that AI-powered querying is placing on the entire analytics stack.
As natural language interfaces become standard, the semantic layer becomes the foundation everything else depends on. A model that does not understand what "close cycle time" means in the context of a finance team, or what "on-time delivery" means against a specific SAP schema, will break down the moment it moves from demo to deployment.
Semantic modelling done at the ERP level -with business context, governed definitions, and certified metrics built in - is what separates platforms that work in production from those that work in a proof of concept.
Conversational Analytics: Closing the Distance Between Data and Decision-Makers
Conversational analytics is often the most visible AI capability to end users and the most discussed in vendor marketing. Evaluated seriously, however, it is a test of something more fundamental: whether an analytics platform can extend trusted data access across an entire organization -not just to analysts and data engineers, but to the VP of Supply Chain who needs an answer before a Monday morning standup.
The bottleneck in enterprise analytics has rarely been the data itself. It has been the distance between the people who have questions and the people who know how to query. Conversational analytics, built on a strong semantic and governance foundation, is what closes that gap at scale.
The platforms that perform well here are built for the way enterprise analytics needs to work: proactive, conversational, semantically aware, and deeply integrated with the operational systems the business runs on.
For teams running on Oracle or SAP, the evaluation criteria matter even more. Complex data structures, non-negotiable governance requirements, and business users who can’t wait on IT for a new report to be built - these are the conditions that separate purpose-built ERP analytics platforms from general-purpose BI tools retrofitted with AI features.
Incorta was built for this environment. We believe being evaluated in all three of these capabilities for the first time in 2026 reflects where the platform has been investing - and where enterprise analytics is heading.
Gartner, Magic Quadrant for Analytics and Business Intelligence Platforms, Anirudh Ganeshan, Christopher Long, Edgar Macari, 29 June 2026.
Gartner and Magic Quadrant are trademarks of Gartner, Inc. and/or its affiliates.
Gartner does not endorse any company, vendor, product or service depicted in its publications, and does not advise technology users to select only those vendors with the highest ratings or other designation. Gartner publications consist of the opinions of Gartner’s business and technology insights organization and should not be construed as statements of fact. Gartner disclaims all warranties, expressed or implied, with respect to this publication, including any warranties of merchantability or fitness for a particular purpose.
Incorta has been recognized for the fifth consecutive year in the 2026 Gartner® Magic Quadrant™ for Analytics and Business Intelligence Platforms.
Enterprise analytics projects fail more often than the industry likes to admit. Not because the technology doesn't work, or because the dashboards aren't well designed. They fail because the data underneath can’t be trusted.
A finance leader who has been burned by a report that contradicts the one their colleague pulled an hour earlier will stop using the tool. A supply chain team that cannot trace where a KPI came from will build its own spreadsheet instead. An IT organization that cannot prove audit-ready lineage from source to dashboard will block the rollout entirely.
Enterprise environments running on Oracle or SAP run into this all the time - the data is complex and vast, user expectations are demanding, and the cost of a wrong number is significant.
Governance prevents this - so why do most enterprises still treat it as an afterthought?
Governance in enterprise analytics is less of a feature, more of an architectural commitment. When your data comes from Oracle or SAP, the security models, the business definitions, and the data lineage all need to be inherited from the source - not reconstructed on top of it. That is what Incorta was built to deliver.
4-Layer Security: Row-level, column-level, object-level, and data classification security -with permissions inherited directly from Oracle and SAP rather than manually mapped in the analytics layer. When a user's access changes in the source system, it is reflected immediately in Incorta. There is no secondary security model to maintain and no risk of the two falling out of sync.
Certified Business Views: A single trusted definition for every metric across the organization. Revenue means the same thing to the CFO as it does to the regional sales lead. Inventory turn is calculated consistently whether it appears in a finance dashboard or a supply chain report. Certified business views eliminate the competing definitions that quietly undermine confidence in analytics platforms over time.
End-to-End Data Lineage: Full lineage from source ERP system to dashboard - traceable, auditable, and available out of the box. When a regulator asks where a number came from, or when an analyst needs to understand why a metric changed, the answer is available without a forensic investigation. This is not a feature most platforms offer at the depth enterprise compliance teams require.
Crowdsourced Trust Layer: Business users can rate, review, and flag data quality on certified views - giving data teams a continuous feedback loop on what is working and what is not. This shifts data confidence from a centralized IT responsibility to a shared organizational practice, and it surfaces issues before they become decisions.
The analytics market is moving fast. AI capabilities are being added to every platform, natural language querying is becoming table stakes, and market growth positioning is shifting quickly.
In an environment where features converge rapidly, governance is the capability that is hardest to replicate. It requires architectural decisions made early, deep integration with source systems, and a sustained commitment to the trust layer that makes analytics usable at scale. Platforms that prioritize speed to market over structural integrity will struggle to close that gap retroactively.
For the enterprises evaluating analytics platforms in 2026, the question is not only which vendor has the most capabilities - it is which vendor's platform will still be trusted by business users a year after go-live.
That is the competitive moat governance builds - and it’s why we believe this score is the most meaningful result for us in this year's evaluation.
Gartner, Magic Quadrant for Analytics and Business Intelligence Platforms, Anirudh Ganeshan, Christopher Long, Edgar Macari, 29 June 2026.
Gartner and Magic Quadrant are trademarks of Gartner, Inc. and/or its affiliates.
Gartner does not endorse any company, vendor, product or service depicted in its publications, and does not advise technology users to select only those vendors with the highest ratings or other designation. Gartner publications consist of the opinions of Gartner’s business and technology insights organization and should not be construed as statements of fact. Gartner disclaims all warranties, expressed or implied, with respect to this publication, including any warranties of merchantability or fitness for a particular purpose.

When we talk about generative AI, the conversation usually centers on writing emails, drafting marketing copy, or answering trivia. But if you look at Anthropic’s recent deployments for Claude, it's clear they are building something entirely different: a fully functional, autonomous data analyst that lives inside your tech stack. Claude has moved past simply "reading" data. It is now executing code, querying live databases, and operating directly inside the spreadsheet tools you already use. Here is why Claude is fundamentally changing how we work with data.
The biggest limitation of early AI models was that they were terrible at math and choked on massive datasets. If you uploaded a 10MB server log and asked a model to find the anomalies, it would try to read every single line of text, flooding its context window, driving up your API costs, and likely hallucinating the answer.
Claude handles this entirely differently using its Code Execution Sandbox.
Instead of trying to "read" the 10MB log file as text, Claude acts like a human engineer. It writes a Python script to parse the log, executes the script in a secure, isolated container, filters out the noise, and returns just the 12 lines of critical errors. You get an accurate answer in a fraction of the time, and because the raw data never hits the language model's main context window, token costs drop by up to 98%.
Data analysis is useless if the data is out of date. While you can easily upload static CSVs or PDFs to Claude, its real power lies in the Model Context Protocol (MCP) and real-time enterprise connectors.
If you are a financial analyst, Claude can connect directly to platforms like FactSet, S&P Capital IQ, or your company's proprietary Salesforce CRM under governed access controls.
Instead of exporting a pipeline report, you can simply ask Claude to identify "at-risk deals for Q1." Claude will write a script, query your live CRM, cross-reference the data with recent engagement metrics, and present a targeted list of accounts that need intervention. The analysis is dynamic, live, and instantly actionable.
You shouldn't have to leave your workspace to talk to an AI. Anthropic recently deployed Claude add-ins directly into Microsoft 365.
If you need to build a financial model, you don't have to prompt an AI in a browser and try to copy-paste the formulas back into a spreadsheet. Claude operates natively inside Excel. It can pull in live data feeds, write complex formulas, and audit existing logic across linked workbooks.
Even better, Claude's ecosystem shares context. Once you finish running a sensitivity analysis in Excel, you can open PowerPoint, and Claude will already know the insights you just discovered, allowing it to immediately draft a pitchbook based on the exact numbers you just finalized.
We are transitioning from using AI as a sounding board to using AI as an execution engine. With a 1-million token context window, progressive skills that understand complex file structures, and the ability to run actual Python code on the fly, Claude isn't just summarizing data anymore—it's actively doing the analytics work for you.
But this raises a massive question: how exactly does Claude navigate multiple data sources from disparate systems, like merging financial billing data with CRM marketing campaigns, and how can it possibly handle enterprise databases with billions of rows and hundreds of columns while being also cost efficient?
The short answer is context orchestration. Using the Model Context Protocol (MCP) and other tools and protocols, Claude doesn't try to cram an entire data warehouse into its memory. Instead, it acts as an intelligent router, authenticating seamlessly across your systems, writing optimized SQL or Python scripts to push the heavy computation down to the database & lakehouse level, and only pulling the final, aggregated insights back into its context window for reasoning. We will dive deep into the exact architecture of querying billion-row datasets and orchestrating cross-platform analytics in our next post, so stay tuned!
The latest updates and resources from us, directly to your inbox. (No spam, we promise!)