
Incorta
Provider
Utility
Type
Tools and Utilities
Business function
Summary
Incorta maintains robust metadata on all aspects of the system including dashboard contents, schemas, views, user permissions and more. Incorta also maintains detailed usage data generated from every user action. So why not use Incorta to report on this data and better understand what your users find valuable, and gain a picture of your system's configuration and dependencies?
Of course, all reports and dashboards are fully editable so that you can customize your reporting to fit your needs.
Deployment Steps
- Download the file Observability.zip.
- Unarchive the zip file.
- The folder contains 3 zip files. -- schemas.zip -- business_schemas.zip -- dashboards.zip
- Import the schemas.zip
- Import the business_schemas.zip
- Import the dashboards.zip
- Execute the Inspector scheduler in CMC (schedule or adhoc)
- Load the “_DateCommon” schema.
- Load the “_IncortaMetadata” schema.
- Load the “_InspectorMetadata” schema.
- Do a quick sanity test of the deployed code by verifying the dashboards.
- Set up schema load schedules suitably.
Content
- 1. Dashboard - User Analytics (BI Audit): User engagement and dashboard analytics. This dashboard is driven from the audit table.
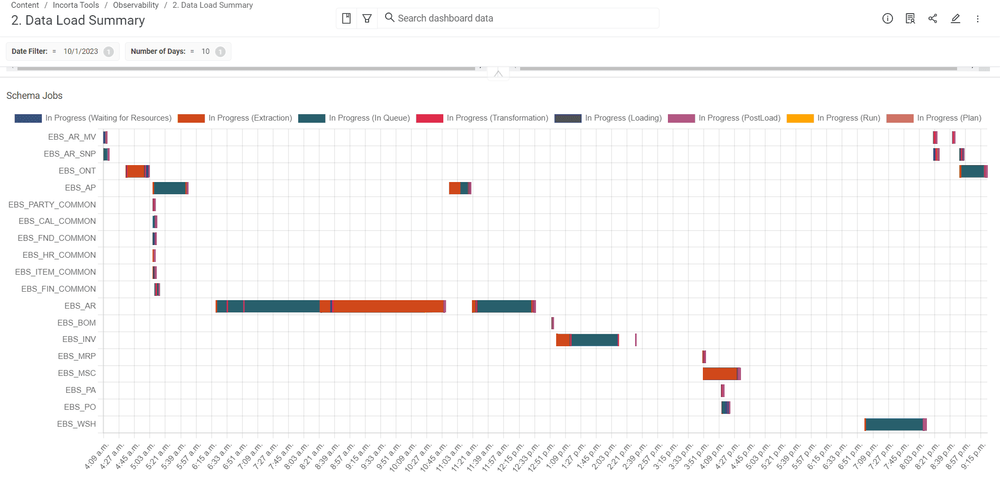
- 2. Data Load Summary (New): Analysis of schema/table jobs (extracts/loads) historically, daily performance and error details
- 2. Data Load Summary - Load Plan (New): Analysis of load plans/schema/table jobs (extracts/loads) historically, daily performance and error details
- 3. Metadata Exceptions (Updated): Analyze metadata issues - warnings, errors etc.
- 4. Unused Entities: Analyze unused physical schema tables/columns
- 5. Data Lineage: Dashboard to business schema to physical schema linking
- 6. SQL Query-User Analytics (BI SQLi_Audit): SQLi usage summary/trends/query details
- 7. Security (Users-Groups-Roles): Overview of Users/Groups/Roles.
- 8. Health Check: Schema load health check - Errors/Performance


Published on:
2024-03-15
Setup Effort:
