
Incorta
Provider
Premium
Type
Supply Chain
Business function
Summary
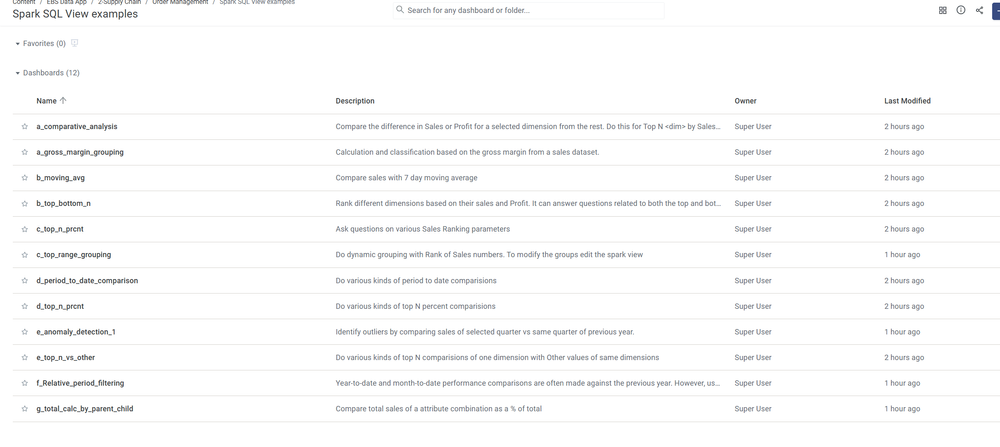
This data application shows how to unlock complex data questions with Spark SQL Views and streamline Data Access with Real-World Examples based on Incorta pre-built content for Oracle Oracle E-Business Order Management . Here are the included dashboards under "2-Supply Chain/Order Management/Spark SQL View examples" based on the Business Schema _inc_app_sales_v1_b
a_comparative_analysis : Compare the difference in Sales or Profit for a selected dimension from the rest. Do this for Top N dimension by Sales or Profit.
a_gross_margin_grouping: Calculation and classification based on the gross margin from a sales dataset.
b_moving_avg: Compare sales with 7 day moving average
b_top_bottom_n: Rank different dimensions based on their sales and Profit. It can answer questions related to both the top and bottom performance of each dimension
c_top_n_prcnt: Ask questions on various Sales Ranking parameters
c_top_range_grouping: Do dynamic grouping with Rank of Sales numbers. To modify the groups edit the spark view
d_period_to_date_comparison: Do various kinds of period to date comparisions
d_top_n_prcnt: Do various kinds of top N percent comparisions
e_anomaly_detection_1: Identify outliers by comparing sales of selected quarter vs same quarter of previous year.
e_top_n_vs_other: Do various kinds of top N comparisions of one dimension with Other values of same dimensions
f_Relative_period_filtering: Year-to-date and month-to-date performance comparisons are often made against the previous year. However, using these metrics with weekly refreshed data can lead to misleading comparisons due to mismatched date ranges.
g_total_calc_by_parent_child: Compare total sales of a attribute combination as a % of total


Published on:
2025-01-06
Setup Effort:
